The age of U.S. drinking water pipes: from Civil War-era mains to today’s replacement crisis
Roughly 2.2 million miles of buried water main carry the nation’s drinking water, and a large share of it was laid before the interstate highway system. A plain-language guide to what is underground, how fast it is failing, and what it will cost to renew.
By Dana Whitfield, Senior Editor, Infrastructure · · 16 min read

The American Water Works Association calls it the Replacement Era. Beneath the streets of nearly every U.S. city and town lies a circulatory system of drinking water pipe so vast — an estimated 2.2 million miles of distribution main, enough to wrap the planet nearly ninety times — that no one alive will see all of it renewed. Much of it was laid in the boom decades after World War II, when national investment in water mains peaked. Some of it, in the colonial cities of the East Coast and the industrial centers of the Midwest, was laid before the Civil War. The Environmental Protection Agency forecast a decade ago that the rate of pipe replacement would keep rising until roughly 2035, and the data since has only confirmed it. We track the public-health and policy dimensions of that work on our Water & Wellness desk.
This is a plain-language guide to what is under your street: how old it is, what it is made of, how fast it is failing, what it costs to fix, and who does the work. It draws on the EPA’s 2023 Drinking Water Infrastructure Needs Survey, the American Society of Civil Engineers Infrastructure Report Card, the American Water Works Association’s burial and break data, and interviews with utility asset managers and contracting firms. The regulatory and funding developments behind the numbers are on our News desk.
A grid laid before the interstate
The American water network is a nineteenth-century system stretched over a twenty-first-century country. Philadelphia laid its first cast iron water mains in the 1810s, drawing from the Schuylkill River with steam engines, and still operates mains installed before the Civil War. New York built reservoirs in the Catskills and piped gravity-fed water a hundred miles to Manhattan. Chicago reversed a river to keep its waste out of its drinking water intake. Louisville, New Orleans, and Boston all have cast iron mains in service that predate electric refrigeration.
The boom came after 1945. Returning veterans, the GI Bill, and the postwar suburban expansion drove a wave of main-laying that crested in the 1950s and 1960s. The EPA’s analysis of installation decades shows that a disproportionate share of the pipe now in service was buried in those two decades — which means it is crossing the 75-to-100-year threshold that marks the useful life of cast iron, all at once. The Replacement Era is not a forecast. It is a demographic reality, the way an aging population is a demographic reality: the cohort is large, and it is arriving at old age together. As we reported in The hidden grid beneath your street is older than the road above it, the pipe under your street is almost certainly older than the road above it.
How old is the pipe, really?
Age, however, is only part of the story. The deterioration of any particular main depends on a bundle of pressures that the installation date alone cannot capture. What material is the pipe? Cast iron, ductile iron, polyvinyl chloride, asbestos cement, galvanized steel, or, in a handful of legacy systems, even wood? Each has a different lifespan and a different failure mode. What are the chemical properties of the soil and the water? Some soils are corrosive enough to eat through a steel main in decades; others are benign enough to preserve cast iron for a century and a half. What is the climate? Cycles of freezing and thawing, drought and saturation, and the pressure swings of peak demand all stress the pipe wall in ways that accelerate failure.
Utilities now combine break histories, soil chemistry, flow data, and acoustic condition assessments to rank which blocks get dug first — a data-driven triage that replaces the older habit of waiting for a rupture. The result is a more honest picture of condition than the installation date alone gives, and a more efficient use of the limited crews available to do the digging. The sensor and analytics work behind that triage is a beat we follow on our Technology & Innovation desk.
Pipe materials and how long they last
A material-by-material breakdown is the fastest way to understand why some mains fail at sixty years and others at a hundred and twenty. Cast iron, the workhorse of the nineteenth and early twentieth centuries, has a median service life of 75 to 100 years, longer in dry, alkaline soils and shorter in wet, acidic ones. It fails by graphitization — the iron slowly dissolves, leaving a brittle graphite skeleton that holds pressure until it suddenly does not. Ductile iron, the successor introduced mid-century, is stronger and more impact-resistant, with a comparable or somewhat longer service life when properly lined and protected.
Galvanized steel, common in service lines and small-diameter distribution from the 1920s into the 1960s, corrodes from the inside out as the zinc coating depletes, narrowing the bore and eventually pinholing. Asbestos cement pipe, widely installed from the 1940s through the 1970s, is light, cheap, and corrosion-resistant, but it becomes brittle with age and its handling during replacement is regulated because of the asbestos content. Polyvinyl chloride, or PVC, became dominant for new small-diameter mains from the 1970s onward: it is corrosion-proof, smooth-bored, and lightweight, with an estimated service life of 50 to 100 years, though it has a shorter track record than iron and is more vulnerable to impact damage during installation. Copper, used mainly for service lines and interior plumbing, lasts 50 years or more and resists corrosion in most soils, which is why it remains the default for the small-diameter connector between the main and the meter.
Regional variations: where the oldest pipe lives
Pipe age maps neatly onto American growth patterns. The oldest mains weave beneath the colonial and industrial cities of the East Coast and the Great Lakes — Philadelphia, Boston, New York, Baltimore, Chicago, Detroit, Milwaukee. These cities built their networks early and densely, and they carry the heaviest burden of pre-1940 cast iron and lead service lines. Cities that grew fast in the latter half of the twentieth century have newer systems. More than half of San Antonio’s water mains were laid between 1980 and 2010, fitting for a metro whose population grew by roughly 70 percent in that span. Phoenix, Las Vegas, and the Sun Belt generally run younger grids, though their challenges skew toward drought resilience and source supply rather than sheer material age.
Replacement rates vary just as widely. A utility in a fast-growing, well-funded suburb may replace 1 to 2 percent of its network a year — the rate many engineers consider the floor for a stable system. Many older, rate-constrained cities replace well under half a percent, which means their networks age faster than they renew and the backlog compounds. The result is a widening gap between the systems that can keep up and the systems that cannot, a divide that tracks closely with municipal fiscal health and, often, with the income of the neighborhoods above the pipe.
The water main break crisis
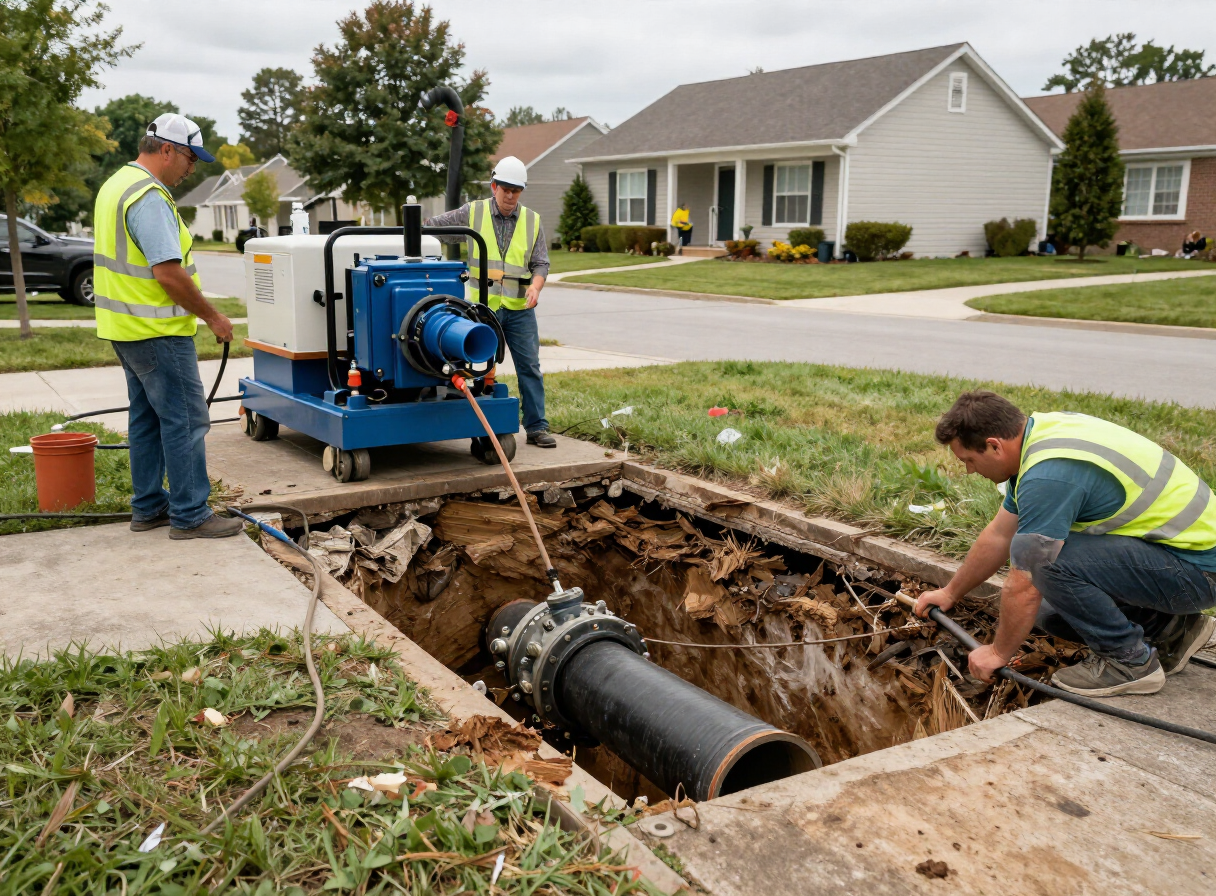
Aging pipe fails, and the failure shows up as breaks. The American Society of Civil Engineers estimates a water main break occurs somewhere in the United States roughly every two minutes — about 6 billion gallons of treated water lost each day, and tens of thousands of ruptures a year. Each break is a small emergency: a closed road, a boil-water notice, a flooded basement, a sinkhole that occasionally swallows a vehicle. Each break is also a data point, and utilities that track break frequency per hundred miles of main can watch a neighborhood’s failure rate climb years before the cumulative cost forces a capital project.
The cost of a break is almost always a multiple of the cost of a planned replacement. An emergency dig means overtime, traffic control on short notice, damaged pavement, and sometimes property claims. A planned dig means a scheduled crew, a printed traffic-control plan, and a patch that matches the street. The economics argue relentlessly for renewal before failure, and the obstacle is almost never engineering. It is funding, and the crews to do the work — the same constraint we documented in The hidden grid beneath your street is older than the road above it.
Lead contamination: the service line problem
The most consequential aging-pipe problem is not the main. It is the service line — the small-diameter connector between the main in the street and the home’s interior plumbing. Lead service lines were standard practice into the mid-twentieth century, and an estimated nine million properties nationwide still have one in the ground. Lead has no safe level of exposure for children, and the replacement of those lines is now a federal mandate with a deadline under the EPA’s Lead and Copper Rule Improvements.
The replacement campaign is one of the largest plumbing efforts in the country’s history, and it has a structural wrinkle: in many jurisdictions the property-side segment — from the curb to the kitchen — is the homeowner’s responsibility, and it is the part most often deferred. Leaving even twenty feet of lead in the ground defeats the purpose of the public-side dig, which is why planners urge homeowners to replace the full line in the same excavation. When the work reaches your block, it is the moment to find a vetted plumber and complete the connection rather than leave the last stretch of lead behind. BestPlumbers.com also publishes a dedicated water quality guide on testing and treatment for homes on aging service lines or private wells.
Water loss: the hidden cost of leaking infrastructure
Breaks are dramatic. Leaks are not. The share of treated water that never reaches a customer — known in the industry as non-revenue water — runs an estimated 15 to 20 percent on average across U.S. systems, and far higher in some older cities. That is water a utility has paid to pump, treat, and pressurize, delivered instead into the soil. The economics compound across 2.2 million miles of pipe: every percentage point of loss is a percentage point of treatment chemistry, electricity, and source water spent for nothing.
Reducing non-revenue water is the single most cost-effective intervention most utilities can make, because it recovers supply that already exists rather than building new source capacity. The toolkit is well established: pressure management, district metered areas, acoustic leak detection, and a disciplined main-replacement program. For homeowners, the same logic applies at a smaller scale — an unexplained rise in the water bill or a meter that creeps when nothing is running is a reason to call before the ceiling does. BestPlumbers.com connects homeowners with leak detection services and broader homeowner resources on what to check first.
What it costs, and who pays
The EPA’s 2023 Drinking Water Infrastructure Needs Survey put the 20-year capital need for the nation’s water utilities at $625 billion, and roughly two-thirds of that total is for transmission and distribution — the pipes. The American Water Works Association estimated a decade ago that restoring the system could require on the order of $1 trillion over 25 years. Whatever the precise figure, it is a number that dwarfs any single funding stream and must be assembled from rate revenue, state revolving funds, federal grants, and the lead service line programs attached to the Bipartisan Infrastructure Law.
Most of the bill is paid by the people who turn the tap. Rate revenue covers operations and a share of capital; revolving funds and federal grants cover the rest, often routed through state agencies that prioritize lead line removal and small-system consolidation. The politics is straightforward and the financing is not: a rate increase to replace pipe no one can see is a hard vote, so capital plans stretch across decades and depend on crews that do not yet exist in sufficient numbers. The companies that win this work are the ones that can hold a schedule for eighteen months without burning out their field — a discipline we have profiled on our Contractors desk.
Climate change is rewriting the design assumptions
Every water system was designed against a historic rainfall and temperature record, and that record is no longer a reliable guide. Drought shrinks reservoirs and forces utilities to restrict pressure, which increases contamination risk when supply returns. Flood overwhelms combined sewers — the older systems that carry stormwater and sewage in one pipe — and discharges untreated waste into rivers, a problem the EPA is forcing Cincinnati, Chicago, and Philadelphia to solve at a cost of billions. Freeze-thaw cycles in regions unaccustomed to deep cold, like Texas in February 2021, rupture mains and service lines that were never insulated for it.
Sea-level rise pushes saltwater into coastal aquifers from Miami to Charleston, ruining wells that served communities for generations. Wildfire destroys the small-system infrastructure of mountain towns and contaminates source water with ash. The engineering response is convergence toward a resilient toolkit: pressure-managed distribution, separate storm and sanitary sewers, decentralized reuse, and drought-resilient source portfolios. The contractors who install greywater systems, rainwater cisterns, and reuse plumbing are the ones whose phones ring through every drought, and BestPlumbers.com offers guidance on water conservation retrofits that homeowners can act on between utility projects.
Smart water technology and leak detection
The cheapest pipe is the one you replace the day before it fails, and the hardest question in the industry is how to know that day. Acoustic monitoring has existed for decades — a pinhole in a pressurized main makes a sound long before it makes a stain — but the cost of listening everywhere at once, and the software to decide which noise matters, only recently crossed into practical. Permanent acoustic sensors, satellite-based leak detection, and AI models trained on break histories now let utilities flag a failure days or weeks before water appears at the surface.
As we reported in Leak detection stops guessing: acoustic sensors meet building-level models, stadiums and hospitals are the proving ground for systems that translate raw noise into ranked repair tickets. The same logic scales down to the home: smart meters and flow sensors can flag a running toilet or a hidden slab leak from a change in overnight consumption. The technology does not replace the plumber; it tells the plumber where to dig, and tells the homeowner when to call. For the residential side of that workflow, BestPlumbers.com lists licensed professionals through its contractor directory, searchable by city or ZIP.
Water quality testing and safety standards
The Safe Drinking Water Act is the legal architecture that holds the system accountable. It sets maximum contaminant levels for more than ninety regulated substances, requires public water systems to test at defined intervals, and gives every customer the legal right to an annual Consumer Confidence Report detailing what was found in their water. The Lead and Copper Rule, and its recent improvements, govern the specific protocol for lead and the service line inventory now underway nationwide. PFAS — the per- and polyfluoroalkyl substances known as “forever chemicals” — became the first new drinking water contaminants regulated nationally in decades when the EPA set enforceable limits in 2024.
Testing is only useful if the results reach the people who drink the water, and if the infrastructure behind the tap is sound. A main that passes a treatment-plant test can still deliver lead-contaminated water if the service line dissolves it on the way to the home. That is why the public-health case for pipe replacement — and especially lead line replacement — is the one that finally moved federal money. The standards and the science behind them are a core part of the reporting we publish on our Water & Wellness desk.
Municipal water system challenges
The average American water utility is small. More than half of the country’s roughly 50,000 community water systems serve fewer than 500 people, and small systems carry the heaviest burden per customer: the same capital project costs roughly the same whether it serves five hundred households or fifty thousand, but the rate base that pays for it is a fraction of the size. Consolidation, regional partnerships, and shared technical assistance are the policy answers, and they are advancing unevenly. Large urban utilities face the opposite problem — scale, but with networks so old and dense that a single main replacement can shut a commercial corridor for weeks.
Both ends of the size spectrum share a workforce problem. The training cycle for a competent distribution crew chief runs longer than the apprenticeship that precedes it, and the country can fund replacement faster than it can train the people who install it. Every conversation about resilience eventually becomes a conversation about recruiting, and every conversation about recruiting becomes a conversation about whether the trade pays and trains in a way a nineteen-year-old can plan a life around. The workforce pipeline behind that question is a beat we follow on our Contractors desk.
The role of plumbers in water infrastructure
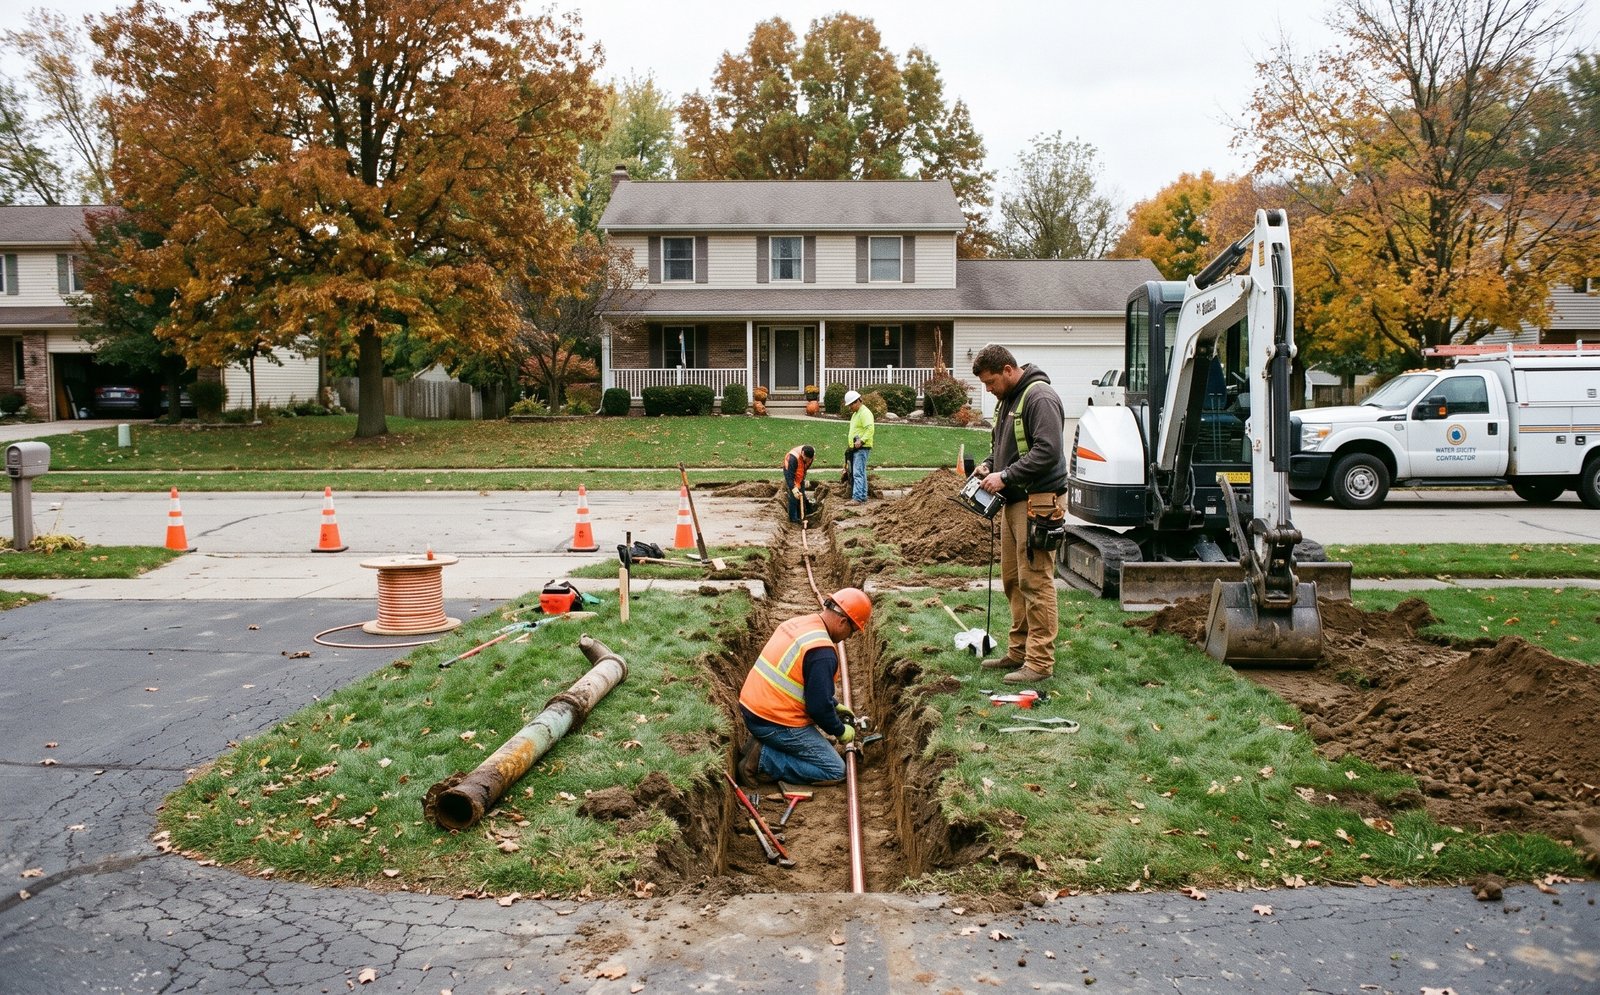
The renewal of the grid is not one project. It is thousands of small ones, negotiated street by street, and almost all of them depend on licensed plumbing and pipefitting crews. The utility sets the capital plan; the contractor digs the trench, replaces the main, and reconnects the service line; the residential plumber handles the property-side connection from the curb to the kitchen. When a lead service line is replaced, the homeowner’s segment is the part most often deferred, and the residential plumber is the one who closes the gap.
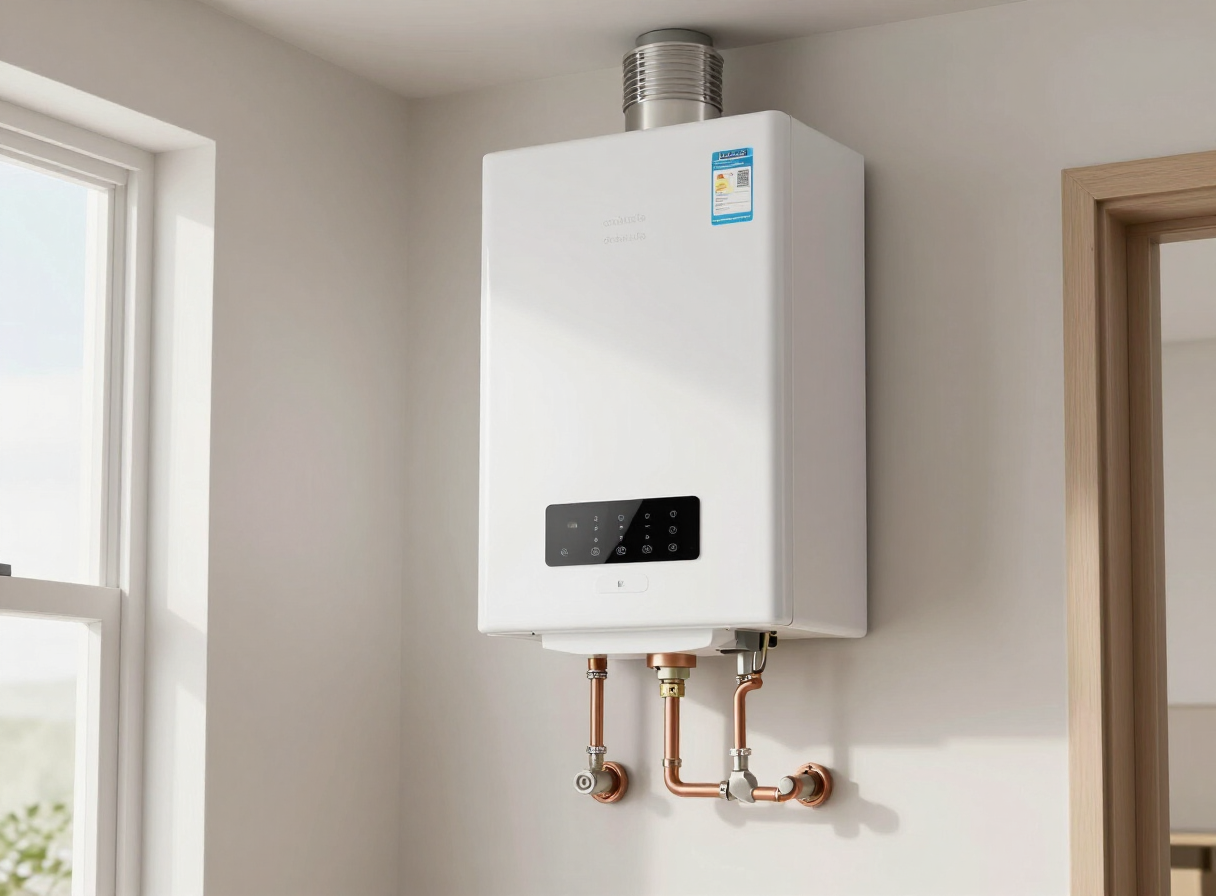
The same trade that replaces a main also installs the pressure regulator that stops the hammer, the backflow preventer that keeps contamination out of the home, and the water heater that ages out on its own roughly decade-long cycle. The work is continuous, local, and licensed — the layer of the system Americans take for granted and much of the world is still building. For the version of that work that reaches your home, BestPlumbers.com connects homeowners with residential plumbing services and licensed professionals searchable by city or ZIP.
Case studies: where replacement is working
A few programs show what disciplined renewal looks like. Philadelphia, with some of the oldest mains in the country, runs a multi-decade main replacement program that prioritizes high-break corridors and pairs main work with lead service line replacement in the same dig, reducing the number of times a street is torn up. Milwaukee has built one of the more aggressive lead service line replacement campaigns in the Midwest, financed through a mix of federal lead funding and local rate revenue, with a public dashboard tracking lines replaced by neighborhood.
Atlanta used its municipal option sales tax to fund a water infrastructure renewal program that has replaced miles of aging main and addressed some of the highest break-frequency streets in the city. Smaller systems have shown that scale is not a prerequisite for discipline: utilities that publish break data, set annual replacement targets, and pair main and service-line work in a single excavation get more renewal per dollar than those that wait for the next rupture. The common thread is not budget. It is a capital plan that treats the buried grid as an asset to be managed rather than a problem to be ignored.
Future infrastructure investment needs
The Replacement Era will run for decades. The EPA projects replacement rates rising into the mid-2030s as the postwar cohort reaches the end of its service life, and the lead service line mandate adds a hard deadline to that curve. The Bipartisan Infrastructure Law directed tens of billions toward drinking water, with a dedicated share for lead line removal and for PFAS treatment in small systems, but the 20-year need still runs into the hundreds of billions and the workforce to install it remains the binding constraint.
The investment that follows will reshape the grid for the next century. The choices made now — pipe material, separation of storm and sanitary sewers, pressure management, reuse capacity, and the sensor networks that monitor it all — will determine whether the system that replaces the postwar network is more resilient than the one it retires. The technology, the standards, and the financing models all exist. The open question is the same one that has always constrained water infrastructure: whether the country will pay for work it cannot see, and train the people to do it. We will keep reporting the answer, one capital plan and one replaced block at a time.
The main doesn’t fail on a schedule. But it does complain for months before it goes. The Replacement Era is just the country finally deciding to take the complaint seriously.
Mariana Solis, utility asset manager
For the homeowner reading this on a city main, the national story is not abstract. The same lead service line being replaced in Milwaukee may be under your front yard. The same drought forcing Phoenix to reuse wastewater may be reshaping your utility’s capital plan. And the same crew that replaces a main on your block is part of a profession that has been moving clean water in and waste out for five thousand years. When the work reaches your property line, BestPlumbers.com connects homeowners with licensed professionals through its plumbing directory and the broader homeowner resources that explain what to check first and when to stop checking and call.
Sources
- U.S. Environmental Protection Agency, 2023 Drinking Water Infrastructure Needs Survey and Assessment
- American Society of Civil Engineers, Infrastructure Report Card, drinking water chapter
- American Water Works Association, Buried No Longer and water main break/burial data
- U.S. Environmental Protection Agency, Lead and Copper Rule Improvements and service line inventory guidance
- Circle of Blue, “Infographic: The Age of U.S. Drinking Water Pipes — From Civil War Era to Today,” February 2016
- Interviews with utility asset managers and contracting firms, conducted July–August 2026
Reported for Best Plumbers News. Code, safety and health guidance varies by jurisdiction and changes over time. Confirm requirements with your local authority and a licensed professional.
Sample CMS data. Stories, quotes and figures below are invented for design demonstration.
About the author
Senior Editor, Infrastructure
Dana has covered municipal water systems and public works financing for eleven years, previously for a regional daily in Ohio. She holds a certificate in water resource policy.